How much inventory is on the Austin housing market right now?
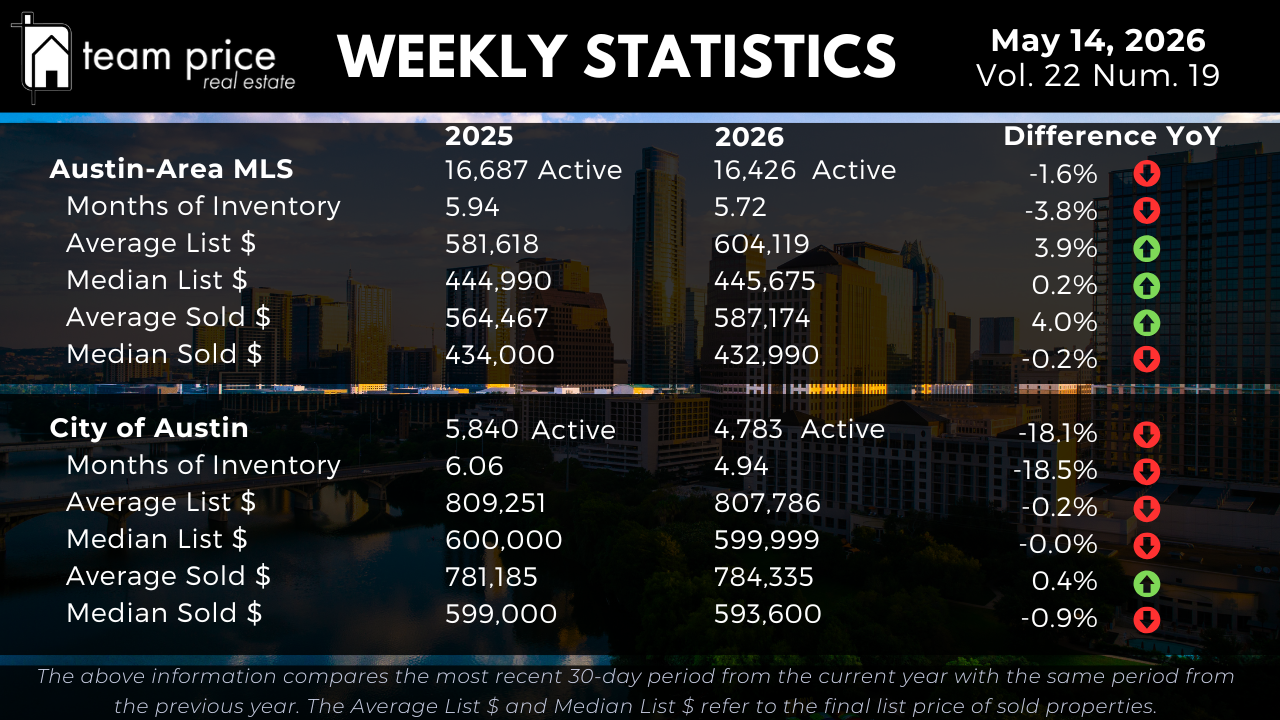
The Austin-Area MLS currently has 16,426 active listings, down from 16,687 at this time last year, a decline of 1.6 percent. Months of inventory sits at 5.72, compared to 5.94 a year ago. That is a slight loosening on the consumption side, suggesting the regional market is finding a more balanced rhythm rather than tightening dramatically.
Inside the City of Austin, the story is more pronounced. Active listings have fallen from 5,840 a year ago to 4,783 today. Months of inventory has dropped from 6.06 to 4.94, a meaningful shift that moves the city closer to balanced-market territory. When inventory contracts this quickly in a defined geography while the surrounding region holds steady, it usually signals that the city has absorbed the bulk of its excess supply faster than the suburbs.
What is happening with Austin home prices?
Average and median sold prices across the Austin-Area MLS are showing mixed signals. The average sold price has climbed to $587,174, up 4.0 percent year over year from $564,467. The median sold price, however, sits at $432,990, a marginal decline of 0.2 percent from $434,000 a year ago. Active listing prices are running higher than last year. The average active list price is $604,119, up 3.9 percent, and the median active list price is $445,675, essentially flat at 0.2 percent. The gap between rising averages and a flat median tells you that higher-end Central Texas real estate is doing more of the heavy lifting on the average. The typical home in the middle of the market is selling for roughly the same as it did last year.
How are City of Austin home prices performing?
City of Austin pricing is holding remarkably steady. The average active list price is $807,786, just slightly below last year's $809,251. The median active list price is $599,999, statistically unchanged from $600,000. On the sold side, the average sold price is $784,335, a small 0.4 percent gain year over year. The median sold price is $593,600, down 0.9 percent from $599,000. For Austin TX homes for sale inside city limits, the price story is one of stability rather than recovery or further decline. Combined with the sharp inventory drop, this stability suggests the city is finding its floor.
How much room do buyers have to negotiate in the Austin market?
The current sold-to-list price ratio across the Austin-Area MLS is 97.91 percent, meaning sellers are still typically accepting slightly less than asking. The negotiation picture this month shows 62.06 percent of all sold properties closing under list price, nearly identical to last month's 62.22 percent. About 21.10 percent closed at list price, down from 22.65 percent. Notably, 16.84 percent of properties sold over list price, up from 15.13 percent last month and well above the 14.93 percent figure from May 2025. That rising over-asking percentage is worth watching. It is still a minority of transactions, but the direction has reversed compared to last year. In specific submarkets, competition is returning.
Which Central Texas cities and ZIP codes are gaining and losing?
Across the 30 tracked Central Texas cities, 17 posted month-over-month price increases and 13 posted decreases. Year over year, the split is closer, with 14 cities up and 16 down. The 75 tracked ZIP codes show 41 with month-over-month gains and 34 with declines. Year over year, 37 ZIP codes are up and 38 are down. This is one of the most balanced city and ZIP code splits we have seen in recent months. The Greater Austin MLS is no longer moving as a single block. Performance is now hyperlocal, which means generalizations about whether the market is up or down miss the more important question of which specific area a buyer or seller is operating in.
How far is the Austin market from its peak?
In the Austin-Area MLS, the average list price peaked in March 2023 at $708,929 and currently sits at $663,156, a drop of 6.5 percent from peak. The median list price peaked at $539,900 in May 2022 and is now $448,000, off 17.0 percent. The average sold price peaked at $664,515 in May 2022 and is now $607,926, down 8.5 percent. The median sold price peaked at $538,000 and is now $455,000, off 15.4 percent. On a per-square-foot basis, the average is down 17.6 percent from its April 2022 peak, and the median is down 22.1 percent.
In the City of Austin, the average list price peaked more recently, in September 2025, at $957,629 and is now $862,455, down 9.9 percent. The median list price is down 12.7 percent from its May 2022 peak. The average sold price is off 6.2 percent from peak, and the median sold price is down 10.3 percent. Per-square-foot figures show the average down 18.1 percent and the median down 18.8 percent from their 2022 peaks. From peak, zero of the 30 Central Texas cities are above their twelve-month high, and only 4 of the 75 ZIP codes are. The market has reset broadly, but it is no longer falling in most places.
What is the outlook for the Austin housing market?
The combination of falling City of Austin inventory, stable urban pricing, a rising share of over-asking sales, and a balanced city and ZIP code split points to a Travis County real estate market that is transitioning out of pure correction and into a more nuanced phase. The regional MLS still favors buyers on volume, with 5.72 months of inventory and a sold-to-list ratio under 98 percent. But conditions are no longer uniformly weak. Sellers in the city, in the right price band, and in the right submarket are finding traction faster than they did a year ago.
Buyers should not assume the leverage they had six months ago still applies in every neighborhood. Sellers should not assume their home will sell quickly without strategic pricing. The next several weeks will clarify whether the city's inventory contraction continues into the heart of the summer selling season.